
Employee stipends aren’t a “nice-to-have.” For many companies, particularly those operating with tight budgets or lean teams (and, in 2026, who isn’t?), they’ve become the default way to run lifestyle benefits programs.
This list brings together the most important employee stipend statistics from Compt’s 2026 Annual Lifestyle Benefits Benchmark Report and 2026 Midyear Lifestyle Benefits Benchmark Report, along with select industry research. Full-year 2025 data gives us the clearest view of employee participation, utilization, and spending behavior, while H1 2026 data shows how employers are changing funding and program design now.
Use these employee stipend statistics to benchmark your employee benefits program, understand current trends in employee perks, and see how other organizations are structuring, funding, and evaluating stipend-based benefits in 2026 and beyond.
2026 employee stipend statistics: key takeaways
- 65% of Compt customers offer an all-inclusive Lifestyle Spending Account (LSA) at midyear 2026, up slightly from 64% in 2025. (2026 Midyear Lifestyle Benefits Benchmark Report)
- Average stipend funding reached $891 per employee, up from $850 in 2025. Small companies averaged $1,642, midsize companies $1,167, and large companies $695. (2026 Midyear Lifestyle Benefits Benchmark Report)
- All-inclusive LSAs saw 93% participation and 89% utilization in full-year 2025 data, the highest of any lifestyle benefits structure measured. (2026 Annual Lifestyle Benefits Benchmark Report)
- Annual funding is the most common employer cadence at 58%, but quarterly funding produced the highest utilization in full-year data at 85%. (2026 Midyear Lifestyle Benefits Benchmark Report)
- Wellness is offered by 42% of Compt customers, up from 37% in 2025, while professional development rose from 20% to 25%. (2026 Midyear Lifestyle Benefits Benchmark Report)
- Professional development median funding doubled from $800 in 2025 to $1,600 per employee at midyear 2026. AI-related tools and learning accounted for 18% of flexible professional development stipend spending, compared with 11% in targeted professional development programs. (2026 Midyear Lifestyle Benefits Benchmark Report)
- Nearly 1 in 10 stipend transactions were for groceries in full-year 2025 data. (2026 Annual Lifestyle Benefits Benchmark Report)
- About 70% of H1 2026 stipend spending occurred outside the top 10 vendors, reinforcing how widely employees spread benefit dollars across different businesses and services. (2026 Midyear Lifestyle Benefits Benchmark Report)
Methodology
The statistics throughout this article come primarily from two Compt benchmark datasets:
- 2026 Midyear Lifestyle Benefits Benchmark Report: January–June 2026 Compt customer data, used for current employer funding, adoption, and program-design benchmarks.
- 2026 Annual Lifestyle Benefits Benchmark Report: January–December 2025 Compt customer data, used where a complete year provides a better view of employee participation, utilization, and spending behavior.
- Dataset: Active Compt customers across industries and company sizes, including U.S. and international programs.
- Participation: Percentage of eligible and active employees who submitted at least one reimbursement.
- Utilization: Percentage of allocated stipend budget that was reimbursed.
- Funding: Employer-allocated annual budget per employee.
- Company-size and industry benchmarks may be influenced by outliers. Where possible, we report medians; where we report averages, we label them explicitly.
Where noted, additional industry comparisons come from external research sources.
Now, because “employee stipend” can mean different things depending on how a program is designed, we’ll start by clarifying what the term actually covers today.
What are employee stipends? How do they differ from perks?
Employee stipends are employer-funded allowances that employees can use for eligible expenses across defined categories. Unlike traditional perks, which are typically tied to a specific vendor, product, or service, stipends give employees flexibility in how and where they spend their benefit.
Employee stipend: An employer-funded benefit that provides employees with a set amount of money for eligible expenses.
Lifestyle Spending Account (LSA): A flexible, multicategory stipend structure that lets employees submit eligible expenses for reimbursement.
In a reimbursement-based stipend program, employers set the funding amount, eligible categories, eligibility rules, and funding cadence. Employees then choose how to use the benefit within those guardrails.
The key difference between stipends and perks is who chooses how the benefit is used:
- Stipends are employee-directed. Employees choose eligible purchases that fit their own needs, routines, and life stage.
- Traditional perks are employer-selected. Their value depends on whether a particular offering or vendor matches what an employee actually wants or needs.
Stipends also differ from cash bonuses or raises. They’re funded for defined purposes and reimbursed according to the employer’s program rules rather than added to base compensation.
For a deeper look at stipend types, tax treatment, examples, and policy design, see our Ultimate Guide to Employee Stipends.
What are the benefits of employee stipends?
Employee stipends give employees more choice over their benefits while giving employers a predictable way to fund that flexibility. Instead of selecting one perk or vendor for your entire workforce, you define eligible categories and budgets while employees choose the purchases that work for them.
For employees, stipends:
- Accommodate different needs, roles, locations, and life stages within the same benefits structure.
- Give employees control over where they spend, rather than limiting them to a specific vendor or catalog.
- Support both recurring expenses and occasional purchases, depending on how the program is designed.
For employers, stipends:
- Keep spending capped and predictable through defined per-category, per-employee budgets.
- Pay out only when employees use the benefit, rather than paying upfront for access that may go unused.
- Consolidate multiple benefit categories into fewer programs and systems.
- Adapt as workforce priorities change without requiring a new point solution for every new benefit.
That flexibility is one reason employers increasingly use all-inclusive LSAs as their benefits infrastructure: at midyear 2026, 65% of Compt customers offered an all-inclusive LSA, up from 64% in 2025 (and up from 55% in 2024).
What percentage of companies offer employee stipends?
There isn’t a single marketwide percentage for how many companies offer employee stipends because employers structure them in many different ways. In Compt’s H1 2026 data, adoption varied substantially by stipend category:
- Wellness: 42% of customers
- Office equipment: 27%
- Professional development: 25%
- Cell and internet: 18%
- Commuter: 9%
- Food: 9%
Overall, adoption increased across 13 of the 20 comparable stipend categories between 2025 and H1 2026, suggesting employers are expanding the range of needs they support even when they aren’t increasing funding equally across every category.
Table: Employee stipend adoption and structure (2026)
| Metric | 2026 benchmark |
|---|---|
| Companies offering all-inclusive LSAs | 65% |
| LSAs with 5+ categories | 82% |
| Companies extending stipends globally | ~20% |
| Dominant funding cadence | Annual (58%) |
| Most common dedicated stipend category | Wellness (42%) |
What employee benefits programs and perks are most commonly offered today?
Outside of LSAs, which are consistently the most common benefits structure in our dataset, the most common dedicated stipend categories in H1 2026 were wellness, office equipment, professional development, and cell and internet. Wellness and professional development are gaining ground fastest, while practical benefits like connectivity, commuting, and food are reaching more employees even as typical funding levels come down.
Here are the details:
- Wellness: Offered by 42% of Compt customers, up from 37% in 2025. Wellness remains the most common dedicated stipend category and gained five percentage points at midyear.
- Office equipment: Offered by 27% of customers, up from 25%. It remains one of the most established practical benefits for remote and hybrid employees
- Professional development: Offered by 25% of customers, up from 20%. It also saw the clearest increase in funding: median annual funding doubled from $800 to $1,600 per employee, with AI-related tools and learning emerging as a major use case.
- Cell and internet: Offered by 18% of customers, up from 15%. Median annual funding declined from $1,080 to $870, suggesting employers are expanding access while keeping per-employee budgets more contained.
- Commuter and food: Each reached 9% adoption at midyear. Commuter rose from 7.6% and food from 7%, even as median funding declined to $1,860 for commuter and $390 for food.
Employers are increasing access to practical support without raising every stipend budget at the same rate. Wellness and professional development are gaining adoption and investment, while categories like commuting, connectivity, and food are reaching more employees at lower typical funding levels.
“This is an amazing addition to our benefits as I’ve been able to use it for both personal self care and for my new pup!”
— Compt user, May 2025
How much do employers spend on employee stipends per year?
Across Compt customers, average annual stipend funding reached $891 per employee in H1 2026, up 5% from $850 in 2025. Funding varies substantially by company size, benefit category, and industry.
Table: Funding benchmarks by company size (H1 2026)
| Company size | Average annual funding | Change from 2025 |
|---|---|---|
| Small (<100 employees) | $1,642 | Essentially flat |
| Midsize (100–1,000) | $1,167 | +11% |
| Large (1,000+) | $695 | +7% |
| Overall average | $891 | +5% |
Small-company funding remained essentially flat from 2025, while midsize funding increased 11% and large-company funding increased 7%. Small companies still allocate about 2.36 times more per employee through the stipend and LSA programs measured here than large companies, down from 2.6 times in 2025.
Funding also varies by industry.
Table: Average annual stipend funding by industry (H1 2026)
| Industry | 2025 | H1 2026 | Change |
|---|---|---|---|
| Biotechnology/Pharmaceuticals | $2,060 | $2,084 | +1% |
| Education | $265 | $325 | +23% |
| Energy | $610 | $677 | +11% |
| Finance* | $2,350 | $2,117 | -10% |
| Healthcare/Medical | $780 | $852 | +9% |
| Hospitality and Tourism | $1,335 | $662 | -50% |
| Manufacturing | $550 | $504 | -8% |
| Media and Entertainment | $770 | $1,615 | +110% |
| Nonprofit | $1,280 | $1,385 | +8% |
| Other | — | $1,568 | No prior benchmark |
| Professional Services | $460 | $413 | -10% |
| Real Estate | $830 | $1,526 | +84% |
| Retail and E-commerce | $1,135 | $672 | -41% |
| Technology | $1,400 | $1,435 | +2% |
*The H1 2026 Finance category corresponds to Banking and Investments in the Annual Report, so the comparison uses the published $2,350 Banking and Investments average.
Industry averages are best used as directional planning context rather than recommended targets. Nearly 90% of employees represented in this analysis work in Healthcare, Professional Services, or Technology, so changes in smaller industries may be more sensitive to the mix of employers in each period.
Are companies cutting employee benefits or changing how they are structured?
Among Compt customers, data from the 2026 Midyear Lifestyle Benefits Benchmark Report points more toward restructuring and reallocation than sweeping benefit cuts. Average stipend funding increased from $850 to $891 per employee, while adoption increased across 13 of 20 comparable stipend categories. Employers appear to be putting more money behind some priorities, expanding access to others, and using existing stipend infrastructure to support more needs.
Professional development shows the clearest increase in investment. Median annual funding doubled from $800 to $1,600 per employee, while the share of Compt customers offering a professional development stipend rose from 20% to 25%.
At the same time, employers are expanding some practical benefits without increasing the typical budget for each employee. Commuter adoption rose from 7.6% to 9%, even as median funding fell from $2,400 to $1,860. Cell and internet adoption increased from 15% to 18% while median funding declined from $1,080 to $870, and food increased from 7% to 9% while median funding fell from $480 to $390.
Program structure is changing, too. Employers are increasingly using established stipends and LSAs to add categories as priorities change rather than introducing a separate program or vendor for every new benefit. All-inclusive LSAs remain the dominant flexible-benefits structure, while newer needs such as weight management are beginning to appear within existing LSA and wellness programs.
Which employee benefits programs have the highest participation?
Full-year 2025 data gives us the clearest picture of employee participation and utilization across benefit types, so this section is rooted in our 2026 Annual Lifestyle Benefits Benchmark Report. FYI: Participation measures the percentage of eligible employees who submit at least one expense during a funding period, while utilization measures the percentage of available stipend dollars employees actually spend.
Participation and utilization data shows that benefits tied to recurring, everyday needs consistently see the most engagement:
- All-inclusive Lifestyle Spending Accounts (LSAs) have the highest participation rate at 93%. They are the most widely used lifestyle benefits structure.
- Cell and internet benefits show 88% participation. These are most relevant for distributed, remote, and travel-heavy roles, and are a required benefit in some states.
- Wellness benefits have 85% participation, particularly when embedded within a broader stipend or LSA program rather than offered on their own.
- Office equipment stipends see 84% participation. These often support hybrid work and ongoing role-based needs.
- Team recognition benefits reach 82% participation, proving strong engagement even in a category designed for episodic use. (Gratitude always wins! And with Compt, team recognition is included in your lifestyle benefits program.)
- Food benefits see 79% participation, underscoring today’s demand for everyday financial support.
- Professional development programs show lower participation at 47%. This indicates their more intentional, opt-in nature, not a lack of value.
Importantly, participation and utilization are not the same measure — and the data makes that distinction clear.
- All-inclusive LSAs combine high participation (93%) with high utilization (89%), indicating that flexible structures absorb a wide range of employee needs effectively.
- Standalone wellness programs show lower utilization (70%) than wellness delivered within an LSA (86%), even when participation is similar.
- Situational benefits like caregiving and out-of-state care are designed for lower participation and utilization, serving as “ground cover” rather than always-on programs.
One important distinction is that with reimbursement-based stipends and LSAs, you only pay for benefits when your employees actually use them. If an employee is allocated a stipend but only uses part of it, you fund only what is reimbursed — unused dollars are never spent. As a result, lower utilization doesn’t mean unused stipend dollars were wasted.
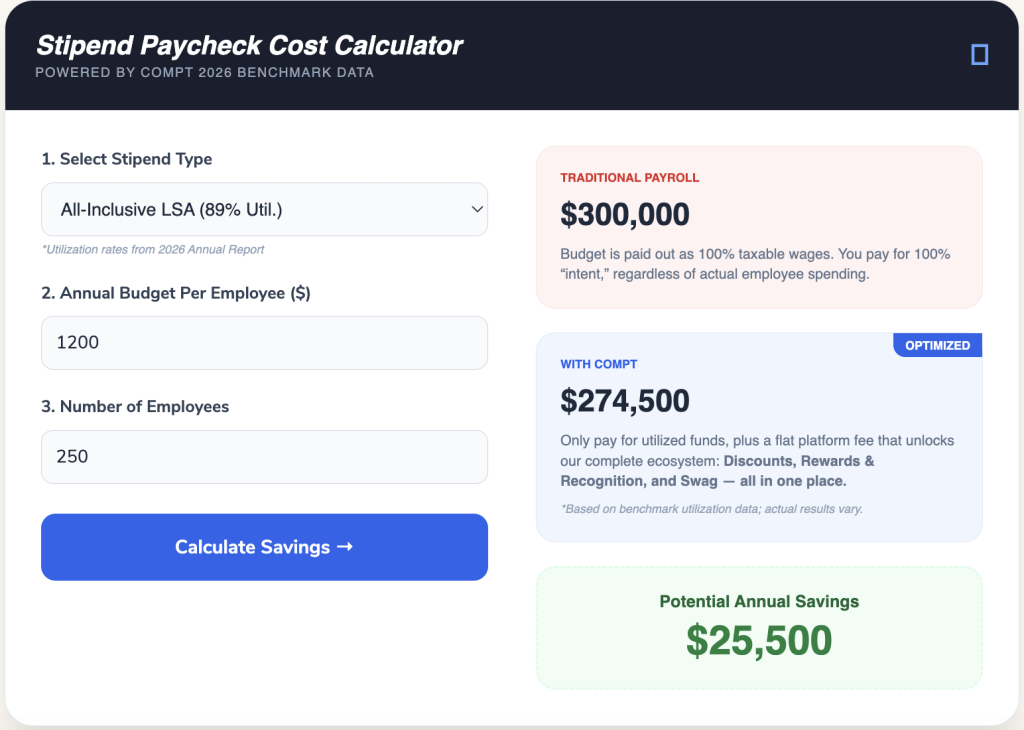
Stop overpaying for underused benefits.
Traditional payroll stipends are paid out 100% regardless of actual use.
With Compt, you only pay for the funds employees spend, saving you thousands while increasing benefits engagement.
The highest participation rates appear in benefits that give employees wide flexibility or cover expenses many employees are likely to have. But participation and utilization answer different questions: a program can reach a large share of employees without every employee spending their full allocation. For reimbursement-based benefits, lower utilization also doesn’t create the same sunk-cost problem as a prepaid benefit.
“Great benefit! Love the flexibility to spend on something you enjoy :)”
— Compt user, September 2024
How do employees use their employee stipends?
When employees are given flexibility, their spending behavior tends to be practical first, with room for discretion when it matters. Employees use their stipends to support a mix of priorities, depending on timing, life stage, and personal needs.
Full-year 2025 data gives us the clearest picture of how employees use their stipends, while H1 2026 data shows where those spending patterns are continuing or changing. Together, Compt’s 2026 Annual Lifestyle Benefits Benchmark Report and 2026 Midyear Lifestyle Benefits Benchmark Report show:
- Nearly 1 in 10 stipend dollars is spent at grocery retailers, showing how employees use flexible benefits for everyday expenses. (And that spending isn’t always tied to a dedicated food benefit: many Compt users submit grocery receipts under health and wellness.)
- Grocery and household spending also became more prominent in 2025: Sam’s Club replaced a national telecom provider in the top 10 merchants.
- Health and wellness remains the single largest spending category, spanning recurring fitness costs, preventive care, mental health support, and everyday health-related expenses that often fall outside standard insurance coverage — not just one-time purchases or gym memberships.
- AI tools and learning accounted for 18% of spending through flexible professional development stipends in H1 2026, compared with 11% through targeted professional development programs such as tuition reimbursement and Professional Development Pro™.
- About 70% of stipend spending occurs outside the top 10 vendors. That pattern continued through H1 2026, with employees using benefits across thousands of local, independent, regional, niche, and national businesses rather than concentrating spending with a small group of providers.
- Employees rarely concentrate spend in a single category, particularly within all-inclusive LSAs, instead distributing usage across multiple everyday and situational needs over time.
Employee stipend usage reflects how people actually live and work. Employees use benefits for everyday expenses like groceries and connectivity, while also spending on health, professional development, and discretionary purchases. That range helps explain why flexible, reimbursement-based benefits can serve employees with very different priorities without requiring them to choose from the same predefined set of vendors.
“You’re helping to pay for much needed groceries! It may sound like a simple thing, but it’s so very important. THANK YOU!!!”
— Compt user, December 2025
What are the biggest employee benefits trends today?
The biggest employee benefits trends in 2026 are greater investment in professional development and AI upskilling, broader access to practical benefits, and more employers using flexible programs to support a wider range of employee needs. Compt’s H1 2026 data shows that employers aren’t overhauling their benefits strategies so much as refining where money goes and what existing programs can cover:
- Professional development is seeing the clearest new investment. Median professional development stipend funding doubled from $800 to $1,600 per employee, while adoption increased from 20% to 25% of Compt customers. AI-related tools and learning accounted for 18% of flexible PD stipend spending, compared with 11% in more targeted professional development programs.
- Practical benefits are reaching more employees at lower typical funding levels. Commuter adoption increased from 7.6% to 9%, cell and internet from 15% to 18%, and food from 7% to 9%. At the same time, median funding fell in all three categories.
- Employers are expanding what their existing benefit infrastructure supports. Adoption increased across 13 of 20 comparable stipend categories between 2025 and H1 2026, rather than growth being concentrated in one or two benefits.
- Global programs are beginning to resemble domestic flexible-benefits programs. Roughly one in five Compt customers supports employees internationally; among those employers, professional development adoption rose from 14% to 22%, wellness from 33% to 42%, and all-inclusive LSA adoption from 57% to 61%.
- Employee choice remains remarkably consistent even as program design changes. About 70% of H1 2026 stipend spending occurred outside the top 10 vendors, close to the roughly 75% Compt observed when it began tracking the benchmark in 2022.
Taken together, the data points to refinement rather than reinvention: employers are putting more investment behind fast-moving priorities, making practical support available to more employees, and using flexible benefit structures to accommodate new categories as workforce priorities change.
How are companies structuring modern employee benefits programs?
The clearest structural trend in the 2026 Midyear Lifestyle Benefits Benchmark Report is that employers are building benefits programs they can adapt rather than continually adding standalone programs. All-inclusive LSAs remain the dominant structure, and employers are using existing stipend infrastructure to accommodate new priorities, different employee populations, and changing workforce needs.
That looks like:
- Existing programs are absorbing new use cases. Emerging support such as weight-management benefits is largely being incorporated into LSAs or wellness programs rather than launched as a separate stipend.
- Program design can vary within the same workforce. Employers can use different categories, funding amounts, cadences, and eligibility rules for different employee groups while keeping them within one operational structure.
- Global programs are following a similar model. Among employers supporting international teams, flexible LSAs increasingly provide the foundation, with portable benefits layered in based on local needs rather than a different system for every country.
- Funding cadence is part of the architecture. Employers are using annual, quarterly, monthly, and other schedules based on their workforce and how they want the benefit to function, rather than treating cadence as an administrative afterthought.
Modern program design is increasingly about creating a flexible foundation, then adjusting categories, funding, cadence, and eligibility as priorities change.
What all this means for employers using Compt
If you’re trying to offer more employee choice without adding another vendor every time priorities change, these benchmarks point toward a flexible foundation you can keep adapting.
That’s what Compt is built for. HR defines who’s eligible, what expenses qualify, and how much employees receive. Compt helps employers configure applicable tax rules, classifies reimbursements for payroll, and applies those rules consistently. Because the platform is reimbursement-based, employers pay for approved employee spending rather than prefunding balances that may go unused.
The same structure can support all-inclusive LSAs, targeted stipends, different employee populations, and new categories as they emerge, giving employees room to choose benefits that fit their lives without requiring HR to rebuild the program around every new priority.
Ready to see how it works? Request a Compt demo.
FAQs: Employee stipend statistics (2026)
In the first half of 2026, 65% of Compt customers offered an all-inclusive LSA, average annual stipend funding reached $891 per employee, and professional development stipend adoption reached 25%. Full-year 2025 data also shows 93% participation and 89% utilization for all-inclusive LSAs, while nearly 1 in 10 stipend dollars was spent at grocery retailers.
How popular are employee stipends in 2026?
Employee stipends and LSAs are well established among Compt customers. At midyear 2026, wellness stipends were offered by 42% of customers, office equipment by 27%, professional development by 25%, and cell and internet by 18%. Employer adoption also increased across 13 out of 20 comparable stipend categories between 2025 and H1 2026.
What are average utilization rates for lifestyle stipends?
Across Compt’s full-year 2025 stipend programs, average utilization was 67% among active users. Utilization varied substantially by funding cadence: quarterly programs averaged 85%, semiannual 70%, annual 65%, and monthly 52%. Utilization also differs by benefit type and program intent.
Are flexible stipends replacing traditional employee perks?
Flexible stipends and LSAs are increasingly being used to cover needs that employers might otherwise address through separate perks or point solutions. Compt’s H1 2026 data shows employers expanding the categories supported within existing stipend infrastructure, including professional development, commuting, food, and emerging benefits such as weight-management support. Traditional perks haven’t disappeared, but flexible programs give employers another way to support multiple needs within one structure.
What employee benefits trends should remote-first companies watch for 2027 planning?
H1 2026 data among Compt customers points to three trends: increased investment in professional development and AI upskilling, wider access to practical support for remote and hybrid employees, and flexible program structures that can accommodate new categories without requiring a new vendor for each benefit.
Editor’s note: Originally published in February 2026, this post has been recently updated for clarity and relevance for our readers.

 No receipt chasing