Employee stipends are one of the most effective ways to support teams: They consolidate what used to be a patchwork of vendors, debit cards, marketplaces, and low-usage perks into a single, streamlined benefit. Instead of separate line items for wellness, professional development, and recognition, stipends allow HR and Finance leaders to simplify operations while still giving employees real choice in what best supports their lives.
With salaries remaining relatively flat for another year and healthcare costs rising, stipends are one of the few benefits that can expand without adding complexity.
But how much should you budget, and how should stipend programs be structured in 2026? Compt’s 2026 Annual Lifestyle Benefits Benchmark Report offers a comprehensive look at how employers are funding stipends and Lifestyle Spending Accounts (LSAs) today — including category-level ranges, funding cadence, and participation patterns across company sizes, industries, and regions.
Below, we break down the most common stipend funding benchmarks using finalized 2026 data to help HR, People, and Finance leaders set realistic budgets, evaluate consolidation into LSAs, and plan benefits programs that employees actually use.

What are typical stipend funding ranges by category?
Stipend funding varies widely by category, but the most effective programs share a common trait: they’re designed around real, everyday employee needs.
Smaller stipends still have meaningful impact when tied to practical expenses. For example, modest office equipment or wellness funding can offset basic work-from-home needs, preventive care, or recurring fitness costs. At the higher end, professional development stipends increasingly support ongoing investments in productivity tools and AI-driven software rather than one-time conferences or certifications.
Rather than running dozens of narrowly scoped programs, many employers choose to consolidate these categories into all-inclusive LSAs. In 2025, 64% of employers in Compt’s dataset anchored their lifestyle benefits this way, allowing a single budget to flex across wellness, professional development, food, caregiving, and other eligible expenses as employee priorities shift.
The table below reflects observed stipend funding ranges from the 2026 Annual Lifestyle Benefits Benchmark Report, shown as minimum, median, and maximum annual funding per employee*. Medians provide the most reliable planning benchmark, while minimums and maximums illustrate the full range of program designs in use today.
| Stipend Category | Minimum | Median | Maximum |
|---|---|---|---|
| All-Inclusive LSA | $50 | $1,200 | $33,000 |
| Cell and Internet | $240 | $1,080 | $1,800 |
| Charitable Giving | $100 | $300 | $1,000 |
| Commuter | $600 | $2,400 | $4,080 |
| Coworking | $1,200 | $1,800 | $3,600 |
| Culture | $25 | $28 | $200 |
| Experiences and Entertainment | $70 | $180 | $200 |
| Family and Caregiving | $1,000 | $2,500 | $12,000 |
| Food | $160 | $480 | $5,020 |
| Office Equipment | $100 | $250 | $2,400 |
| Out-of-State Care | $1,000 | $3,500 | $4,000 |
| Pets | $150 | $150 | $150 |
| Professional Development | $50 | $800 | $10,000 |
| Sabbatical | $1,000 | $4,750 | $6,000 |
| Safety Equipment and Uniforms | $100 | $150 | $250 |
| Team Recognition | $200 | $220 | $240 |
| Wellness | $12 | $735 | $36,000 |
*Alphabetized data from Compt’s 2026 Annual Lifestyle Benefits Benchmark Report, per employee per year.
How do stipend distribution trends affect employee engagement?
How stipends are funded matters just as much as how much is offered. In the 2026 data, employee engagement shows up across two related measures:
- Participation is the share of employees who use a benefit at least once during the year.
- Utilization reflects the share of issued stipend funds employees actually spend within a given cadence.
Participation remains the primary indicator of employee value, while utilization varies intentionally based on how a program is designed.
Funding cadence helps explain utilization patterns:
- Quarterly funding delivers the most consistent utilization, averaging 85%, and is well suited for helping employees cover recurring needs while maintaining predictable spend.
- Semiannual funding averages 70% utilization, typically used for more targeted programs with fewer distribution events.
- Annual funding averages 65% utilization, reflecting its role in larger, episodic investments such as professional development, certifications, and AI-related tools.
- Monthly funding averages 52% utilization, particularly in programs not tied to fixed, recurring expenses.
It’s also important to interpret utilization in context:
- Lower utilization does not indicate lower employee value.
- Some stipends — including caregiving, charitable giving, and out-of-state care — are intentionally designed as safety nets, with utilization reflecting when support is needed rather than how relevant the benefit is.
Takeaway for 2026: Design for participation first, then use funding cadence to support program intent. Quarterly funding has emerged as the most reliable model for balancing employee engagement, budget control, and administrative simplicity.
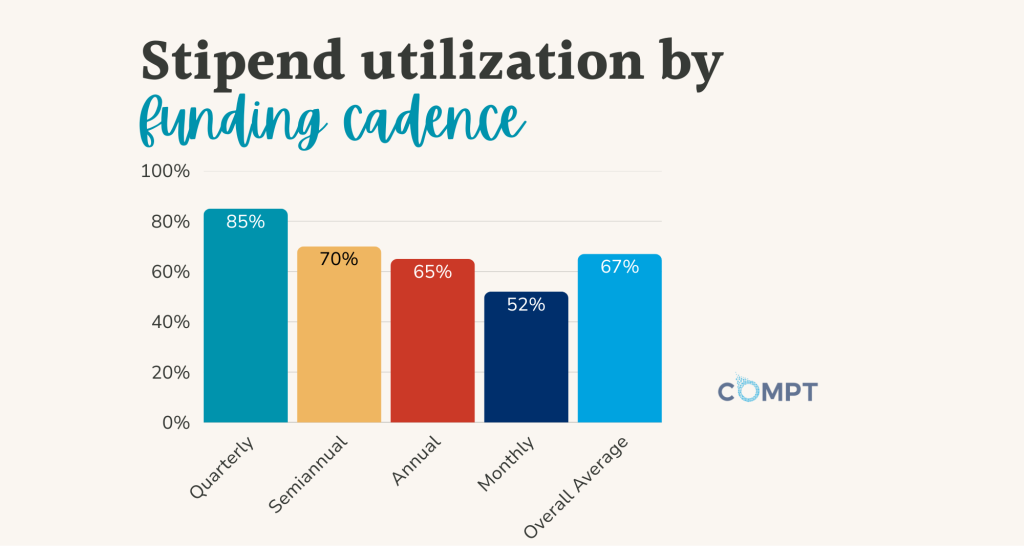
Note: Utilization reflects spend divided by funds issued within each funding cadence.
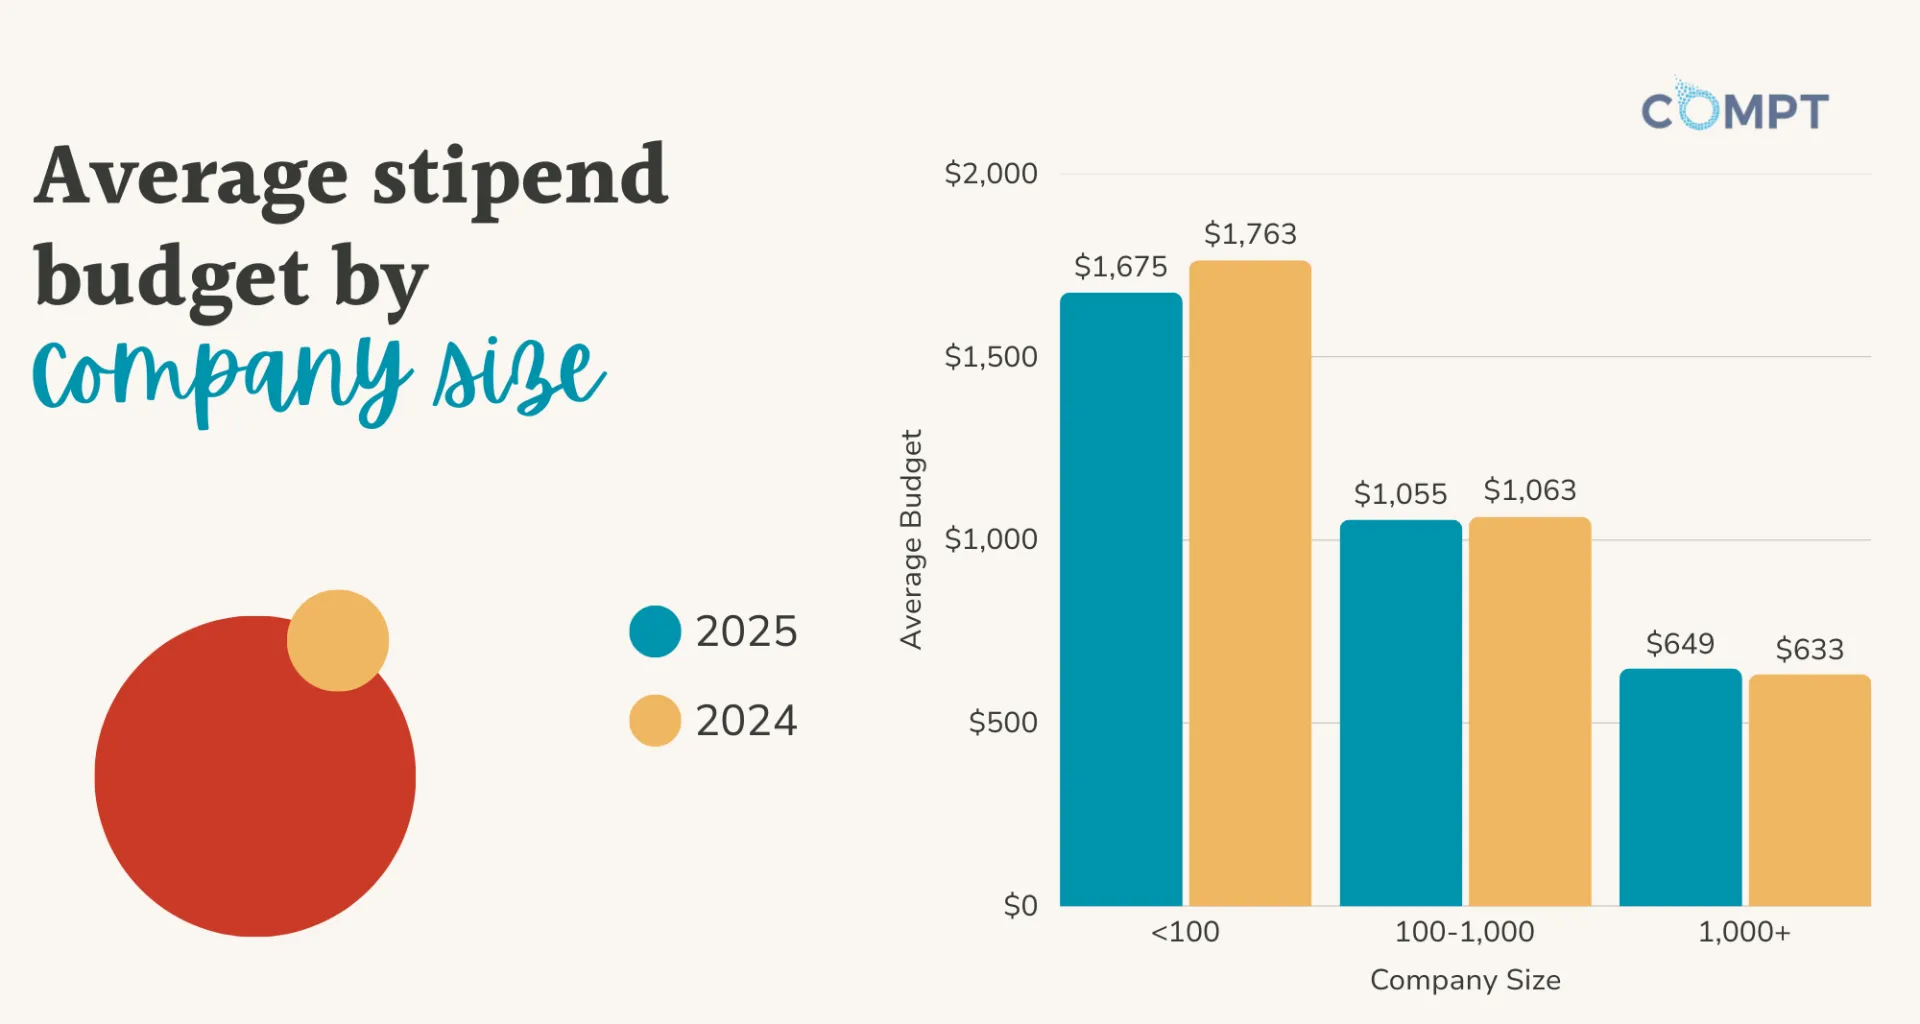
What is the average stipend per employee by company size?
Average stipend funding varies by company size, reflecting how employers balance budget pressure with the need to offer benefits that scale across their workforce.
In 2025, average stipend funding across all employers reached $850 per employee, down slightly from the midyear snapshot. This shift does not signal reduced commitment to employee benefits. Instead, it reflects tighter budgets paired with more deliberate program design, including consolidation into all-inclusive LSAs and fewer, better-funded programs.
By company size, the data shows a consistent pattern:
- Small companies (fewer than 100 employees) continue to invest the most per employee, averaging $1,675 annually. With smaller workforces, these employers often use stipends and LSAs to replace multiple point solutions while maintaining flexibility.
- Midsize companies (100–1,000 employees) averaged $1,055 per employee, focusing on refining existing stipend programs rather than adding new ones.
- Large companies (1,000+ employees) averaged $649 per employee. At scale, per-employee funding is lower, but these companies often offer larger salaries, with lifestyle benefits programs designed for broad access across large, distributed teams.
Across all company sizes, the trend is consistent: employers are prioritizing benefits that drive participation and simplify administration, rather than expanding budgets or layering on additional vendors.
How do stipend budgets vary by region?
Average stipend funding varies by region, shaped by differences in cost of living, labor markets, and how employers structure benefits for distributed teams. These regional averages provide planning context — not targets — and are best interpreted alongside company size and program design.
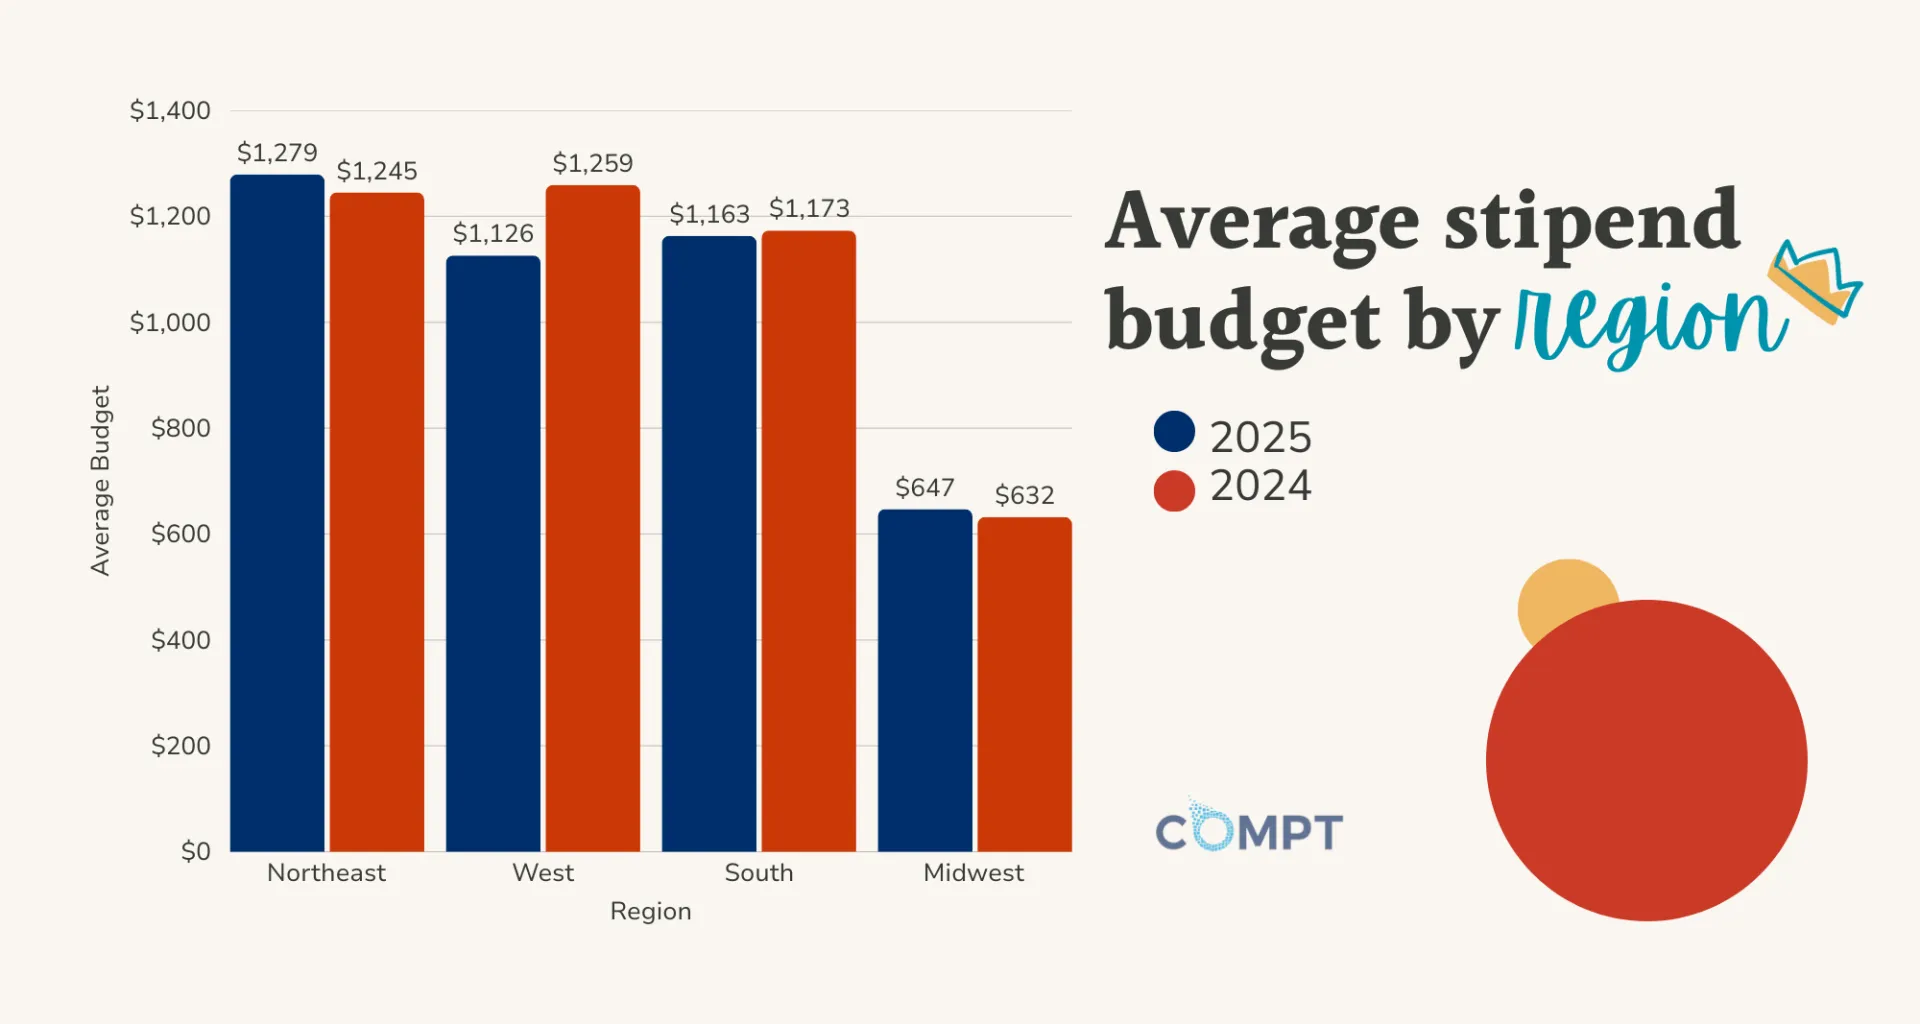
In 2025, regional stipend funding followed a familiar pattern:
- Northeast: Employers averaged $1,279 per employee, reflecting sustained investment in long-established business hubs where benefits programs tend to be embedded and consistent.
- West: Average funding reached $1,126 per employee, with continued emphasis on flexible benefits in regions with higher living costs and competitive talent markets.
- South: Employers averaged $1,163 per employee, driven by workforce growth in states like Texas and Florida and the need to support increasingly distributed teams.
- Midwest: Average funding was $647 per employee, the lowest of any region, reflecting lower cost-of-living pressure.
Across regions, the data shows that employers are not chasing regional extremes. Instead, many are setting a consistent baseline stipend or all-inclusive LSA for all employees, then layering in additional support only where required by competitive pressure, role-specific needs, or compliance considerations.
For multiregion and remote-first employers, this approach simplifies administration while supporting equitable access to benefits — a strategy that becomes even more important as companies expand across states and countries in 2026.
Curious about international stipend funding and global parity? Download the full report — detailed international benchmarks start on page 16.
What should employers keep in mind for 2026?
In 2026, employers are designing stipend programs around two constraints: rising costs and limited operational capacity. Instead of expanding benefit line items, they are consolidating spend into all-inclusive LSAs and fewer, better-funded programs that employees actually use. The data shows that this approach improves participation while keeping budgets predictable, especially when benefits are designed to flex across everyday needs and the discretionary moments employees value most.
Across company sizes and regions, the most effective programs share a consistent set of design choices:
- They anchor lifestyle benefits in a single, flexible structure rather than maintaining multiple point solutions.
- They fund benefits on a cadence that aligns with how employees plan and spend.
- They measure success through participation and relevance, not just utilization.
- They support practical expenses — from wellness and food to professional development tools — without adding administrative complexity.
As employers plan for the year ahead, the most effective starting point isn’t adding new perks. It’s identifying which existing programs, stipends, and reimbursements can be consolidated into fewer, more flexible benefits that scale with the workforce and adapt as employee needs change.
Turn 2026 employee benefits benchmark data into a plan with Compt.
The 2026 Annual Lifestyle Benefits Benchmark Report gives you the data behind stipend funding ranges, participation, and program design decisions across company sizes, industries, and regions.
If you’re still pressure-testing budgets or comparing approaches, download the report to ground your planning in real employer data.
When you’re ready to act, a Compt demo can show you how to apply those benchmarks by consolidating stipends and LSAs into one flexible, compliant program that scales with your workforce.