Written by Holly Hazelton
Holly Hazelton is a people-focused content and communications leader with more than 10 years of experience supporting HR, benefits, coaching, and people analytics audiences. She has shaped employee experience narratives and content strategies for Workhuman, Crunchr, and AceUp, helping leaders create workplaces where people feel seen, supported, and connected. She also founded a global ERG for working parents, reflecting her belief that human-centered storytelling drives stronger performance and belonging.

Connect with Holly on LinkedIn.
Across organizations, HR, Finance, and Total Rewards leaders continue to face a persistent question: how to evaluate the ROI of employee benefits in a way that feels credible to the business.
When these leaders talk candidly about employee benefits ROI, two important truths surface. First, ROI looks different across companies. Some teams prioritize cost control, others prioritize growth — and each requires a different lens. Second, tying benefits to exact dollar returns is inherently difficult. As one Director of Total Rewards put it, benefits ROI often feels like “fuzzy math,” especially when it’s framed as a precise dollar-for-dollar return.
This guide offers a practical framework for measuring the aspects of employee benefits ROI that are both credible and defensible, grounded in candid conversations the Compt team had with five HR and Total Rewards leaders who navigate these tradeoffs every day.
It is designed specifically for HR and Total Rewards leaders who need to make a clear, Finance-ready case for discretionary perks and lifestyle benefits. No complex tools, advanced modeling, or speculative assumptions required.
Executive summary: Measuring employee benefits ROI
When evaluating employee benefits ROI, focus on:
- Cost efficiency: Reduce vendors and unused spend
- Participation and utilization: Prove employees actually use the benefit
- Operational simplification: Save HR and Payroll teams time and headaches
- Directional business impact: Monitor retention and absenteeism trends
Finance leaders prefer trend data and measurable efficiency over speculative ROI claims.
What is employee benefits ROI?
Employee benefits ROI refers to the measurable business value generated relative to the cost of a benefits program, including cost savings, operational efficiency, participation, and directional workforce outcomes.
For HR practitioners and people leaders, employee benefits play a central role in how supported employees feel at work. According to Gartner, only 45% of employees believe their organization cares about their personal well-being. That means more than half of employees feel burned out, disengaged, or disconnected from company leadership.
The right well-being benefits influence outcomes like retention, productivity, and absenteeism, but those impacts rarely show up as clean line items on a balance sheet. The challenge, then, is translating those outcomes into an ROI story Finance can evaluate with confidence.
“I try to bring my benefit ideas forward by focusing on alignment and credibility. CFOs are naturally data-driven, so the first step is to establish that the proposal is grounded in benchmarking and market expectations. … Measuring ROI in benefits is inherently difficult. Unlike a capital investment, you can’t easily quantify the value of a healthier, more engaged workforce. I’ve worked with a lot of wellness companies who put out fuzzy math that I’ve never quite bought into — and I’m not going to bring numbers I don’t fully believe in to my CFO.”
— Senior Director of Total Rewards and HR Technology, midsize software development company
How to assess ROI on employee benefits programs
At its core, ROI helps assess whether the money invested in a program appears to deliver business value relative to its cost. HR teams can calculate ROI in two ways: anticipated or actual ROI.
| Anticipated employee benefits ROI | Estimated before a project begins. You’ll gather projected costs, along with reasonable assumptions about retention, cost efficiency, or workforce stability. Then you model a few scenarios to help leaders understand risk and decide whether to move forward. |
| Actual employee benefits ROI | Measured after a project concludes. This version utilizes final costs and observed outcomes to assess whether the program appears to deliver a positive, negative, or neutral return. Positive ROI becomes evidence to secure more resources or reinvest in what’s working. |
Your basic ROI formula should look like this:
ROI = (Total benefits – total investment) / total investment × 100
This formula is commonly used across HR initiatives, including benefits programs, but it’s best framed as a directional tool rather than a precise calculation. For this guide, we’ll focus on how to use it to measure employee benefits ROI on stipends and Lifestyle Spending Accounts (LSAs).
What do CFOs care about when it comes to employee perks and benefits?
When CFOs evaluate employee perks and discretionary benefits, they typically focus on five core questions:
- Cost control: Is spend predictable and defensible?
- Waste reduction: Are we paying for benefits employees actually use?
- Operational efficiency: Does this reduce unnecessary vendors, manual processing, or administrative headaches and overhead?
- Risk exposure: Are tax handling and compliance clear and consistent?
- Competitive positioning: Does this help us attract and retain talent without escalating costs?
Unlike HR, CFOs rarely evaluate benefits based on sentiment alone. They want to see structured reporting, participation data, utilization rates, and evidence that the program is either replacing existing costs or reducing future risk (such as turnover).
This is why participation, utilization, and vendor consolidation often matter more in ROI conversations than abstract engagement scores.
6 ways to measure the ROI of LSAs and stipends
Wondering which metrics help finance prove ROI when you replace point-solution perks with a single lifestyle benefits wallet?
These six metrics reflect the most practical ways HR and Finance teams assess employee benefits ROI on discretionary perks and lifestyle benefits, ordered from the most concrete and easiest to defend to more directional signals that add context over time.
1. Cost efficiency
Cost efficiency is the most straightforward way to talk about employee benefits ROI with Finance because it aligns well with what they already care about: reducing waste and improving budget predictability.
Look for signs that your lifestyle benefits program helps you:
- Reduce waste from unused perks, breakage, one-off swag purchases, or “set it and forget it” benefits
- Retire underused tools or overlapping vendor programs; consolidate invoices
- Improve budget visibility and forecasting
- Free up HR time for higher-impact work by reducing manual processing and tax guesswork
For many CFOs, predictability matters more than raw cost reduction. A stable, forecastable benefits line item is often preferable to volatile discretionary spend.
“When I bring a new perk or discretionary benefit to leadership, the ROI that they are primarily looking for is cost savings — or vendor consolidation or reduction. … There is a core cost piece, but there is also just an effort, logistic, and administrative burden piece. They want to understand that we are improving on both fronts, not just one.”
— Head of People Operations and Total Rewards, midsize manufacturing company
You can also quantify time savings from streamlined processes. For example, if your team spends hours each month tracking which benefits are taxable vs. nontaxable, log that time, multiply it by your internal hourly cost, and track the reduction after centralizing administration. That becomes a concrete, defensible ROI input.
What this may look like in practice:
- Replace 5-12 perk vendors with one clean stipend budget.
- Result: Fewer invoices. One payroll integration. One set of policy rules.
- CFO summary: Consolidation reduces administrative burden, saves us time, and improves budget predictability.
“Try and quantify the financial impact. Even if there is an increased cost, is there savings somewhere else on the other side? For example, thinking about Compt: If you implement Compt, can that eliminate the need to send out gift cards to every employee for a company event? And we all know that gift cards, they’re lost. They go unused. And so, that’s money that’s just kind of wasted by the company.”
— Head of Total Rewards, midsize B2B HR tech company
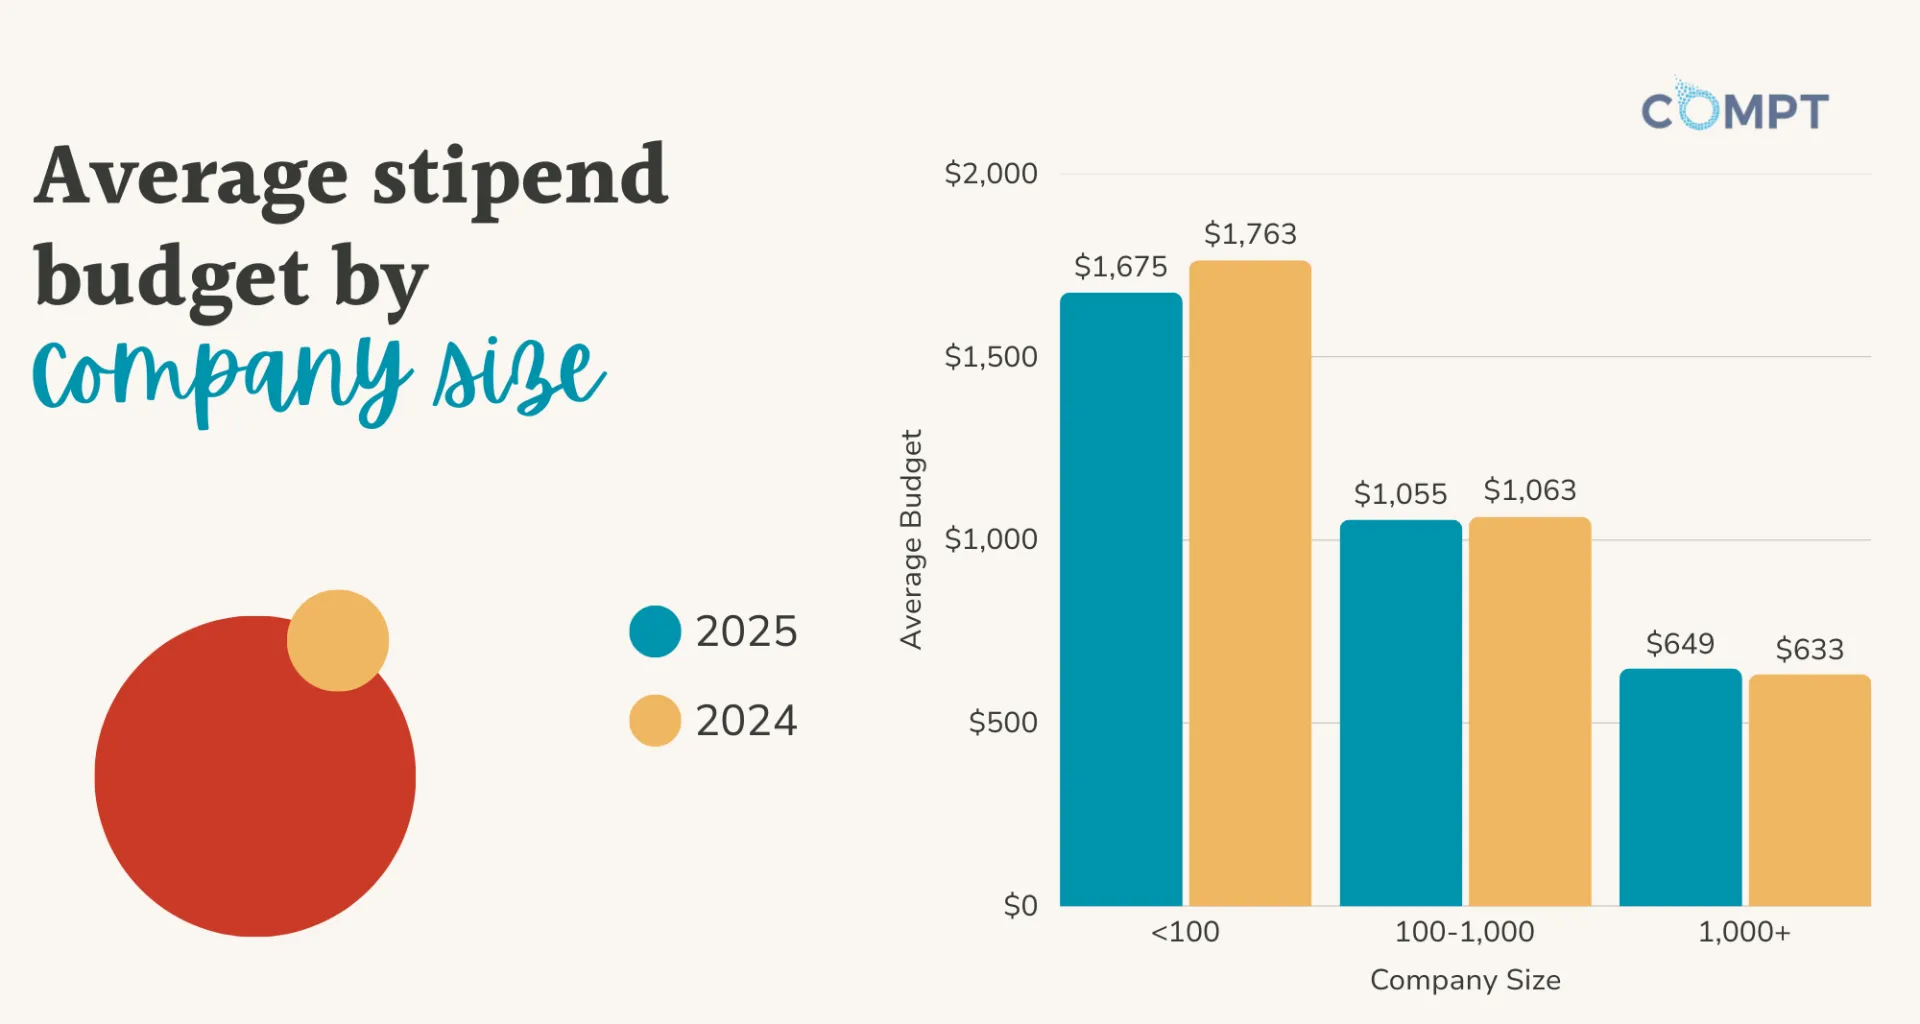
According to Compt’s 2026 Annual Lifestyle Benefits Benchmark Report, small companies (fewer than 100 employees) invest an average of $1,675 per employee on stipends. That’s more than double what large enterprises spend. This means cost efficiency is even more important for smaller teams.
Once you’ve framed efficiency, the next most CFO-friendly ROI argument is risk: What happens if your benefits fall behind the market?
2. Competitive positioning and benefits FOMO
Competitive positioning is one of the clearest ways to frame employee benefits ROI. If your benefits don’t meet market expectations, the cost shows up fast: roles become harder to fill, fewer candidates accept offers, and you experience higher attrition from previously dedicated employees.
Beyond this, nothing activates the executive team’s emotional brain more than hearing competitors are outcompeting them, and it often results in swift approvals for your request.
Start by identifying the employers you compete with for the same talent, then compare their benefits offerings against your own package. If they offer benefits that you don’t, pressure-test whether your employees (and candidates) actually care about those perks.
Competitive benchmarks show what candidates expect, while your own employees reveal what truly makes a difference for them.
“The most important way that I try to position things as far as ROI is competitive positioning. The whole purpose of benefits and rewards in general is to attract and retain talent. If we don’t have a benefit, or if our benefit isn’t as good as what is out there in the market for the talent that we want to get, then that’s a gap that we need to close.”
— Head of Total Rewards, midsize B2B HR tech company
These patterns also explain why flexible, multicategory benefits like stipends and LSAs tend to outperform narrow, vendor-based perks: they help you stay competitive without constantly adding another tool.
Once you’ve established that a benefit is competitive, Finance will ask the next obvious question: Are employees actually using it?
3. Participation rates
Participation rate reflects how many employees use a benefit in a given time period. It’s often the simplest way to show whether a program is reaching your workforce at all.
To calculate participation, divide the number of employees who used the benefit during a specific period by your total number of employees.
For example:
- 500 employees
- 50 use the benefit each month
- 50 / 500 = 10% participation
Depending on the benefit you’re reviewing, 10% might be great — but it also might be low. For a benefit like tuition reimbursement, that may be high enough. However, for programs focused on wellness initiatives, it would be considered low. It’s important to keep the specific fringe benefit’s goal in mind, as well as look for industry benchmarks to know if/where there is room for improvement.
Here’s what this may look like before and after LSA launch:
- Participation rate: 32% before LSA launch → 91%+ (Compt benchmark) after.
- Higher adoption across all demographics and departments.
- CFO summary: High participation indicates the benefit is relevant and not wasted spend.
Tools to measure participation:
- A simple spreadsheet
- HRIS reimbursement data
- Industry benchmarks for similar employers
- Compt’s Current Team Engagement YTD report, which shows the percentage of employees who have used their stipend at least once this year
“We do look at participation rates of the different benefits offerings; that’s always a part of the conversation. … And then the other thing that we always bring to the table, if we can, is industry benchmarks: What are other companies at our size and scale offering to their employees from a benefits perspective? All those combined would be part of the pitch to Finance. If it’s going to save the company money, then that always lands well.”
— Sr. Director and Head of Total Rewards, midsize B2B SaaS company
Participation tells you who is using the benefit. Utilization tells you whether the money you allocated is actually being spent.
4. Utilization rates
Utilization rates are most useful for stipends and LSAs because employee spending amounts are fixed. Utilization shows how much of your allocated benefits budget employees actually use.
- Participation = how many employees engage with a benefit
- Utilization = how much of the allocated dollars are actually spent
A simple utilization formula looks like this:
Utilization rate = actual amount spent / total amount available
Example:
- $150,000 allocated for an annual wellness stipend (500 employees × $300 per year)
- $98,000 reimbursed to employees
- $98,000 / $150,000 = 65% utilization
This means employees used 65% of the dollars the company set aside for wellness.
Utilization can also be seasonal or situational. You might find that:
- Wellness categories are consistently used more than narrower perks like tuition reimbursement because they support a wider range of employees.
- Caregiving or family support categories see higher usage during specific seasons.
- Food or commuter categories rise during return-to-office periods.
- CFO summary: Category spend shows what employees value and how benefits support real-life needs.
Where to find utilization data:
- Manual category tagging
- HRIS exports
- Compt’s Stipend Usage Month Over Month report, which provides a quick snapshot of trends
“What we’re trying to do with our benefits is what brings the most value to the employees who are using them.”
— Director of People Operations, midsize data analytics company
Once you have participation and utilization, Finance will usually ask for the harder question: what business outcomes do these benefits influence?
5. Business outcomes
Beyond sentiment and usage data, Finance typically looks for signals tied to business performance. Lifestyle benefits can influence outcomes such as absenteeism, retention and turnover, productivity, and performance indicators, but it is important to treat these as directional, not purely attributable.
Start by pulling business metrics you likely already track, including:
- Absenteeism trends
- Turnover and retention rates
- Performance and pulse survey results
- One-on-one manager feedback and recurring performance review themes
- Team-level productivity indicators your organization already uses
The goal is not to claim a single benefit caused a specific outcome. Instead, connect the dots between usage, employee feedback, and directional movement in the metrics that matter to your business.
Directional patterns HR teams sometimes observe:
- Customer Support turnover: 18% before launch → 12% after launch.
- Engineering turnover: 9% before launch → 6% after launch.
- Greatest improvements among caregivers and early career talent (demographic insights).
- CFO summary: If retention improves among high-cost roles, replacement costs may decrease over time.*
*While these are great numbers to have available, keep in mind that some CFOs might consider them fuzzy math. Factors that can impact turnover vary widely, from improved manager training to greater clarity on company goals to the company simply performing better.
“Highly engaged business units experience 78% less absenteeism and 14% higher productivity.”
— Gallup, 2025
That said, even when benefits influence these outcomes, Finance still needs to understand whether the program is efficient relative to its cost. This is why participation, utilization, and cost efficiency should sit at the center of your ROI story.
Finally, layer in engagement data to add context: it helps explain why participation and outcomes may be moving.
6. Employee engagement
Employee engagement is one of the most common metrics leaders review when evaluating benefits, but it is best used as supporting evidence rather than the foundation of your ROI story. Engagement data can strengthen your narrative when it aligns with participation, utilization, and cost efficiency trends.
Here’s a simple way to measure it:
- Pull a baseline engagement score from your HRIS or quarterly employee surveys (e.g., eNPS).
- Add a simple pulse-check question to your next survey (e.g., “Do you feel supported by our fringe/discretionary/perks benefits?”).
- Compare before-and-after results following the launch of your LSA.
- Look for trends across teams or demographics.
- Review related metrics, such as retention and turnover rates, and use exit feedback to understand what’s driving employee departures.
If you see an engagement lift after launching a lifestyle stipend or LSA, call it out as a corroborating signal — especially when it matches what you see in participation and utilization.
What an engagement shift may look like:
- Pulse survey question: “Do you feel supported by our benefits?”
- Pre-LSA responses: 46% yes
- Six months after launch: 72% yes
- CFO summary: Higher engagement signals stronger productivity, morale, and day-to-day performance.
“If you look at eNPS, offer acceptance rates, retention rates, turnover rates — there’s multiple facets of why someone comes or goes or is happy or not happy. Having a tie-back to those is important for us to try and figure out what’s driving each. So, we look at those, and even look at why people are leaving or the feedback as they’re exiting, and see if there’s things that they’re leaving for or from.”
— Head of Total Rewards, midsize B2B HR tech company
Of course, you can track any of these metrics manually in Excel, but you can save a tremendous amount of admin time and headaches by simplifying these processes in a single system like Compt.
Curious about how to use this type of data to evaluate the effectiveness of your benefits? Check out the Compt guide, “When to Reevaluate Your Employee Benefits: 6 Signs Your Program Needs a Refresh.”
Which benefit categories see the highest ROI?
The employee benefits categories that see the highest ROI are those that combine broad participation, predictable spend, and measurable operational efficiency.
In Compt’s 2026 benchmark data, all-inclusive LSAs reached 91%+ participation across customer programs — significantly higher than most single-category vendor perks.
Not all employee benefits deliver the same measurable impact. Some categories consistently outperform others by driving higher participation, more efficient spend, and clearer links to business outcomes. These high-ROI categories have one thing in common: they support real-life needs, not one-size-fits-all perks.
| Benefit category | Why it delivers high ROI | Example outcomes |
|---|---|---|
| Lifestyle Spending Accounts (LSAs) | Maximum flexibility. Employees choose what they need within clear guardrails, including wellness, professional development, WFH support, meals, and caregiving. | High participation Reduced perk waste Reduced vendor sprawl Decreased administrative overhead |
| Wellness and mental health | Broad appeal across demographics. Directly supports burnout reduction and overall well-being. | Lower absenteeism Improved morale Better productivity |
| Caregiving (childcare + elder care) | Reduces stress and absenteeism for caregivers, who make up ~60% of the workforce. | Fewer schedule disruptions Lower absenteeism Higher retention among caregiver populations |
| Student loan repayment support | Provides direct financial relief for early- and mid-career employees in high-turnover roles. | Stronger retention Higher engagement in critical talent segments such as nursing |
Learn more in our:
- What Is a Lifestyle Spending Account (LSA)? 2026 Employee Benefits Guide
- Ultimate List of Employee Stipend Statistics (2026): Adoption, Funding, Participation, and Usage
- 2026 Annual Lifestyle Benefits Benchmark Report
Why these categories outperform one-size-fits-all vendors
High-ROI benefits categories tend to share three traits:
- Flexibility: More employees can use them.
- Relevance: They solve immediate, real-life needs.
- Ease of use: Low friction makes participation more likely.
Because no two employees are the same, flexible lifestyle benefits tend to deliver stronger and more measurable ROI than narrow, vendor-based perks.
From a Finance perspective, these categories outperform others because they reduce waste, consolidate vendors, and make participation and spend easy to track.
When low usage signals it’s time to consolidate perks
Utilization data doesn’t just show what’s working — it also highlights when a benefits strategy needs to change. Low usage is one of the clearest indicators that it’s time to move toward a unified LSA or multicategory stipend. When employees barely touch their perks, it often signals a deeper disconnect between benefits design and employee needs.
What low usage usually means:
- Misalignment: The perk doesn’t reflect employee needs or values.
- Waste: Dollars sit unused quarter after quarter.
- Platform fatigue: Too many tools and hoops to jump through.
- Admin drag: HR maintains multiple vendors with limited impact.
- Opaque data: Finance lacks clear visibility into usage and spend.
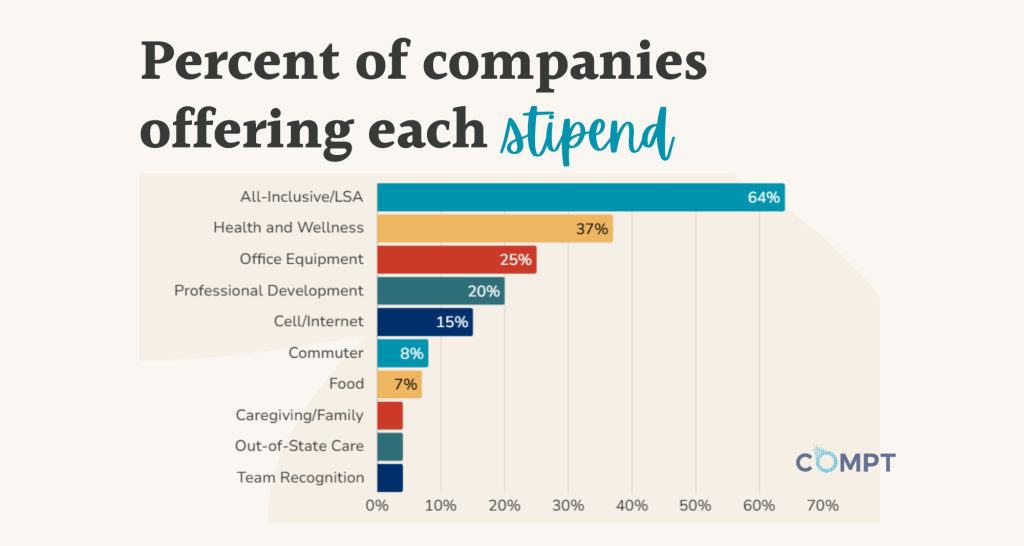
By centralizing all lifestyle perks into one predictable line item, HR can reduce waste and simplify its benefits structure. According to Compt’s 2026 Annual Benchmark Report, 64% of companies now offer all-inclusive LSAs for these reasons: to reduce vendor sprawl, increase utilization, and simplify reporting.
With this model, usage rises (Compt customers average 91%+ participation), spend becomes more predictable, and Finance gains a more centralized view of participation, investment, and category-level usage.
“The most effective business cases succeed when they connect the investment to who the company is, its values, its mission, the people it serves.”
— Senior Director of Total Rewards and HR Technology, midsize software development company
How Compt makes employee benefits ROI easier to see
Measuring employee benefits ROI can be simple. When you focus on the fundamentals like cost efficiency, competitive positioning, participation, utilization, business impact, and engagement, you get a clear view of what is working and what employees genuinely value.
LSAs naturally make participation and cost efficiency easier to track. Compt simplifies this further by centralizing reporting, reducing manual work, and improving visibility into how employees use their stipends. HR leaders can then use platform insights (such as participation, category-level usage, and the simple fact of having all your lifestyle benefits in one place) to support ROI conversations with Finance.
Ready to see how this looks in practice? Request a Compt demo today.

FAQs: ROI of lifestyle benefits and discretionary perks
Below are the most common questions CFOs and HR leaders ask when evaluating employee benefits ROI.
CFOs care about predictability, efficiency, and risk control when evaluating employee benefits ROI. Specifically, they want to know:
1. “Is the cost predictable and defensible?”
2. “Are employees actually using the benefit?” (participation and utilization)
3. “Does it reduce vendor sprawl or administrative overhead?”
4. “Does it replace other discretionary spending?”
5. “Is tax treatment and compliance handled correctly?”
CFOs rarely evaluate benefits based on sentiment alone. They look for structured reporting, measurable adoption, and operational proof that the program improves efficiency or reduces risk over time. Finance leaders typically prefer directional trends and operational proof over speculative dollar-for-dollar ROI claims.
Which benefits categories see the highest ROI?
The benefits categories that see the highest ROI are those that combine broad participation, flexible use, and operational efficiency. These typically include:
1. Lifestyle Spending Accounts (LSAs)
2. Wellness wallets and mental health benefits
3. Caregiving support
4. Professional development and tuition reimbursement stipends
These categories outperform narrow, vendor-based perks because they are relevant to more employees, reduce unused spend, and are easier to measure through participation and utilization data.
How can we measure the success or ROI of our LSA program?
Start with measurable adoption metrics:
-Participation rate (how many employees use the benefit)
-Utilization rate (how much of allocated funds are spent)
-Category-level usage trends
Then layer in operational indicators such as vendor consolidation, administrative time saved, and spend predictability. Finally, use directional signals like retention trends or engagement survey results to provide context without claiming strict causation.
CFOs typically prefer trend data over a single ROI percentage. Showing stability, efficiency, and sustained usage over time builds a more credible ROI story.
Which metrics help Finance prove ROI when replacing point-solution perks with a single lifestyle benefits wallet?
Finance typically looks for measurable efficiency signals when replacing point-solution perks with a single lifestyle benefits or wellness wallet. These include:
-Participation rate and utilization rate
-Reduction in vendor count
-Administrative hours saved
-Spend predictability over time
-Clear tax classification and payroll reporting
The strongest ROI cases show that consolidation reduces operational complexity while maintaining or improving employee adoption.
How should HR track the ROI of stipends for CFO reporting?
For CFO reporting, focus on trend lines rather than a single ROI percentage. Report quarter-over-quarter changes in participation, utilization, vendor reduction, and administrative efficiency.
Include evidence of replaced discretionary costs (such as gift cards or underused perks) and show whether stipend spend remains predictable over time.
Finance leaders value stability and clarity more than speculative return projections.
What’s the ROI of LSAs compared to one-size-fits-all perks?
LSAs often outperform one-size-fits-all perks because employees can spend on what’s relevant to them, which increases perceived value and reduces money tied up in low-usage programs. For Finance, LSAs can also simplify the benefits portfolio by consolidating multiple discretionary perks into a single, trackable, consolidated stipend model.
What metrics should Finance track to show ROI on tuition and professional development stipends during budget reviews?
Focus on outcomes Finance recognizes: participation and completion rates, retention of stipend users, internal mobility or promotions, and reduced turnover in hard-to-fill roles. Add employee feedback on career growth for context. These stipends rarely produce immediate savings, but they can strengthen workforce stability and reduce turnover-related costs over time.
How can companies highlight the long-term ROI of offering AI literacy benefits in their perk catalog?
Frame AI literacy as capability building. Track participation in learning, self-reported confidence, manager feedback on applied skills, and internal mobility into AI-adjacent roles. Over time, look for productivity signals and reduced dependence on external help. This works best as a strategic investment story tied to workforce readiness, not short-term savings.
What’s the ROI of lifestyle spending account (LSA) software vendors?
LSA software ROI usually shows up in operational efficiency: fewer vendors to manage, simpler administration, and clearer reporting on how funds are used. Finance teams often value the ability to track adoption and spend in one place and reduce manual work tied to reimbursements, policy rules, and tax handling (without relying on “fuzzy math” or speculative projections).