Let’s be real.
Lifestyle benefits in 2026 are defined less by what they cover and more by how they adapt.
Employees continue to use these programs to support health, learning, experiences, and other quality-of-life investments that make work more sustainable and rewarding. At the same time, that flexibility allows benefits to respond to changing economic conditions and rising everyday costs, without forcing employees or employers to choose between practicality and value.
This adaptability is reshaping how lifestyle benefits are designed and evaluated. Rather than adding new perks or expanding category lists, many employers are simplifying programs into flexible structures that employees can use in different ways throughout the year, depending on what matters most in the moment.
To understand how this shift is playing out in practice, Compt analyzed customer data from January through December 2025 across industries, company sizes, and regions. The resulting 2026 Annual Lifestyle Benefits Benchmark Report shows how companies are structuring lifestyle benefits today, where budgets are actually going, and how employees engage with the flexibility they’re given.
The insights below reflect the current state of lifestyle benefits in 2026 — including category mix, regional funding patterns, participation trends, and vendor diversity — and highlight the program structures that consistently drive meaningful use without redefining lifestyle benefits as either purely practical or purely aspirational.

Compt Annual Benchmark Report: How companies are building lifestyle benefits in 2026
The 2026 benchmark data shows a clear pattern in how companies are designing lifestyle benefits today: employers are prioritizing flexible, consolidated programs over standalone perks.
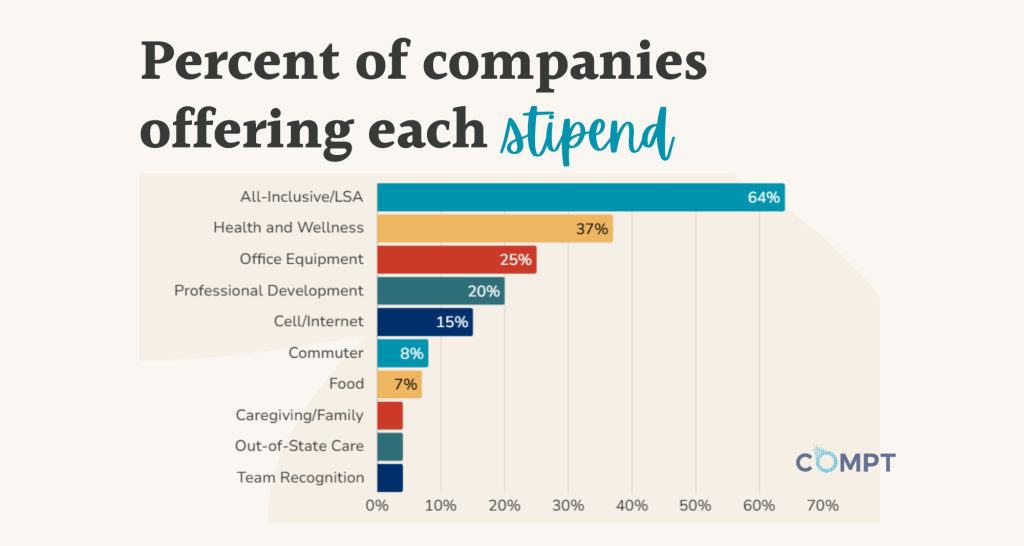
Nearly two-thirds of companies now anchor their lifestyle benefits with an all-inclusive Lifestyle Spending Account (LSA), using a single structure to support multiple categories rather than maintaining separate programs. Targeted stipends like health and wellness, professional development, food, and connectivity remain common, but they increasingly appear within broader, more flexible benefit designs.
This approach reflects a shift away from expanding benefits category by category and toward simplifying how programs are structured and managed. Rather than signaling which benefits should matter most, the data shows how employers are building adaptable frameworks that allow employees to direct support toward what’s most relevant to them, while giving HR and Finance teams greater consistency, control, and visibility.
Average lifestyle benefits program budget by region in the U.S.
Lifestyle benefit funding varies by region, shaped by differences in cost of living, employer mix, and how companies prioritize flexibility within their benefits programs. The 2026 benchmark data shows meaningful variation in average per-employee budgets across regions, but those differences are best understood as context, not indicators of over- or under-investment.
What the data also reveals is how employers are navigating these regional differences without fragmenting their benefits strategies. In Compt’s 2026 Annual Lifestyle Benefits Benchmark Report, we break down the specific design approaches companies use to support regional variation, including how flexible benefit structures enable access to local vendors while maintaining consistency for HR and Finance teams. The report also covers international stipend design.
Rather than relying on location-specific rules or separate programs, leading employers are using flexibility and employee choice to adapt benefits to different markets. The full report explores how these approaches show up across regions, industries, and company sizes.

How lifestyle benefit funding varies by company size
Company size plays a meaningful role in how lifestyle benefits are funded, but not always in the way employers expect. The 2026 benchmark data shows that differences in average per-employee funding often reflect operating realities, such as workforce composition, administrative scale, and budget predictability, rather than differences in commitment to employee support.
Smaller organizations tend to allocate more funding per employee, while larger companies typically operate at lower per-employee averages, reflecting differences in total rewards mix and administrative scale. In practice, this doesn’t translate to better or worse benefits. Instead, it reflects how companies of different sizes design programs to balance access, consistency, and financial control.
The 2026 Annual Lifestyle Benefits Benchmark Report breaks down funding patterns by company size in more detail, showing how employers adjust program structure, cadence, and category mix as they scale — and why participation and program effectiveness don’t necessarily correlate with higher per-employee spend.

The 10 most popular vendors by stipend amount spent
When it comes to where employees direct their lifestyle benefits spend, flexibility drives diversity.
In 2025, employees used lifestyle benefits across more than 64,000 unique vendors globally, with the majority of spend flowing beyond large national retailers. While familiar names like Amazon and Walmart continue to appear among the top vendors, 70% of total spend went to local, regional, niche, and independent businesses.
This distribution isn’t a byproduct; it’s the result of how lifestyle benefits are structured. Compt’s open reimbursement model allows employees to use benefits where support is most relevant to them, whether that’s a neighborhood gym, a local childcare provider, a specialized wellness service, or an everyday retailer that fits their routine.
Rather than concentrating spend within a predefined marketplace, flexible lifestyle benefits expand choice and reflect real spending habits. The 2026 Annual Lifestyle Benefits Benchmark Report explores how vendor diversity varies by category, region, and benefit structure — and why access to local vendors plays a key role in driving participation without increasing administrative complexity.

See how Compt helps companies scale lifestyle benefits programs
Interest in flexible lifestyle benefits is high, but execution is where many programs stall. As teams become more and more lean, manual workflows and unspecialized tools become the real barriers to scaling benefits that employees actually use.
Among Compt customers, participation among active users reaches 93%, showing how flexible benefits perform when reimbursements, approvals, and reporting are built to handle real complexity without adding operational drag.
The 2026 Lifestyle Benefits Benchmark Report
The 2026 Annual Lifestyle Benefits Benchmark Report explores how leading companies are building lifestyle benefits programs that scale, including the structures, systems, and benchmarks that support participation and long-term ROI.
For HR and Finance leaders, the report provides a clear view into how peers and competitors are designing benefits in 2026 and what differentiates programs that attract and retain talent.
FAQs: The state of lifestyle benefits in 2026
In 2026, companies are increasingly structuring lifestyle benefits around flexible, consolidated programs, with all-inclusive Lifestyle Spending Accounts (LSAs) becoming the dominant operating model. Benchmark data shows that 64% of Compt customers now anchor their lifestyle benefits with an all-inclusive LSA, up from 55% the year prior.
Rather than maintaining separate wellness, professional development, food, or connectivity stipends, employers are using a single flexible structure to support multiple categories. This allows programs to adapt to changing employee needs throughout the year without adding new vendors, new policies, or additional administrative burden.
The 2026 Annual Lifestyle Benefits Benchmark Report breaks down these structures in more detail, including how consolidation varies by industry, company size, and workforce mix, and how funding cadence and category layering affect participation.
What lifestyle benefit trends does Compt see across industries?
Industry benchmarks reveal meaningful differences in how lifestyle benefits are funded and structured, even as overall program structures converge around flexibility.
For example, industries such as Banking and Investments and Biotechnology/Pharmaceuticals show higher average per-employee funding, while Education and Professional Services operate at much lower averages. These differences reflect operating realities and workforce composition, not differences in employer commitment to benefits.
Importantly, industry averages vary widely — the highest-funded industries spend roughly nine times more per employee than the lowest-funded — which is why industry benchmarks are best used as planning context rather than targets.
The full industry benchmark tables, including average funding by industry and accompanying design snapshots that show how programs are structured in practice, are available in the 2026 Annual Lifestyle Benefits Benchmark Report.
How do HR and Finance leaders evaluate participation versus engagement in lifestyle benefits programs?
HR and Finance leaders increasingly rely on participation as the primary indicator of whether a lifestyle benefits program is working. Participation measures how many employees actively use a benefit, providing a clearer signal of relevance than engagement metrics, which are often defined inconsistently across tools and vendors.
In the 2026 data, participation among active users reached 93%, with the highest participation tied to benefits designed for recurring needs, including all-inclusive LSAs, cell and internet stipends, wellness, and office equipment. Lower participation in categories like out-of-state care or charitable giving is often intentional and reflects these categories’ episodic design.
The report goes deeper by pairing participation with utilization and funding cadence, showing how quarterly, annual, and monthly programs perform differently depending on intent. The 2026 Annual Lifestyle Benefits Benchmark Report includes category-level participation and utilization tables that help leaders evaluate success in context rather than against a single benchmark.
What benchmark data does Compt use to assess the ROI of lifestyle benefits?
Compt evaluates the ROI of lifestyle benefits using benchmarks that HR and Finance leaders consistently find credible in real budget conversations. Rather than relying on speculative dollar-for-dollar returns, the focus is on a combination of cost efficiency, competitive positioning, participation, utilization, and operational impact.
The 2026 benchmark data looks first at cost efficiency, including how consolidated benefit structures reduce waste from unused perks, overlapping vendors, and manual administration. It then layers in competitive benchmarks, helping leaders understand whether their benefits offering aligns with market expectations for the talent they are trying to attract and retain.
From there, ROI is assessed through participation and utilization patterns, which show whether benefits are reaching employees and whether allocated funds are actually being used. These metrics provide a clearer signal of value than engagement scores alone and allow Finance teams to evaluate predictability and budget efficiency over time.
Finally, the benchmarks provide context for directional business outcomes, such as retention patterns, absenteeism trends, and workforce stability. These outcomes are treated as signals rather than strict attribution, helping leaders connect benefits usage to broader organizational health without relying on “fuzzy math.”
The 2026 Annual Lifestyle Benefits Benchmark Report includes detailed tables and industry-specific benchmarks that allow HR and Finance leaders to apply this ROI framework using peer data, funding ranges, and participation norms relevant to their organization.